Engineering the Data Science Lab: A Paradigm Shift in Autonomous Research

I developed the Data Science Lab project to challenge the traditional, manual bottleneck of data analysis. My vision was to create a truly agentic system - one that does not just execute code but orchestrates an entire research lifecycle with the nuance and strategy of a human researcher. This study showcases the agent's performance on the 2021 Indonesian socioeconomic dataset, a complex environment featuring 514 regional entities.
1. Operational Architecture: Orchestrating the Lab
The Data Science Lab is built on a "Strategic-First" architecture. Unlike standard Jupyter-based workflows, my agent operates through a structured cognitive chain. It treats every dataset as a unique problem space that requires autonomous planning before a single line of code is executed.
The 10-Step Automated Lifecycle
My agent follows a deterministic yet intelligent path to transform raw data into policy insights. This visualization illustrates the internal state machine that governs the research process:
Cognitive Mapping and Planning
When provided with a research goal - such as "Predict regional expenditure and identify growth levers" - the agent initiates a recursive planning phase:
- Variable Contextualization: It identifies target hierarchies and assesses the "semantic weight" of each feature.
- Dynamic Module Selection: The agent evaluates if the problem requires Non-Linear Models for discovery or Linear Frameworks for coefficients.
- Resource Management: It autonomously configures the computational environment, ensuring that high-cardinality features are handled with optimized memory footprints.
2. Integration: Harnessing the Agentic Skill
To make this technology accessible, I engineered the Data Science Lab as a modular Agentic Skill. This allows any advanced AI assistant to pair with the lab and execute high-level research through simple natural language commands.
How to Use the Skill
Interacting with the lab involves three simple components:
- Target Dataset: Provide the path to a CSV or JSON file (e.g.,
2021socio_economic_indonesia.csv). - The Research Prompt: Issue a high-level goal. For example: "Perform a deep-dive research on the provided socioeconomic data to identify disparities in regional expenditure."
- Execution Chain: The agent autonomously triggers the 10-step research pipeline, persisting its progress in Linear or Markdown journals to ensure transparency.
This "Zero-Touch" approach means the human researcher provides the vision, while the agent handles the tactical heavy lifting.
3. Case Study: Socioeconomic Resilience in Indonesia
To demonstrate the agent's capabilities, I triggered it with a complex, real-world challenge using a comprehensive dataset of Indonesia's regional landscape.
Experiment Setup
- Data Source: 2021 Indonesian Socioeconomic Survey (SUSENAS).
- Scope: 514 Cities and Regencies across 34 Provinces.
- Objective: Predict average monthly expenditure per capita and identify the primary socioeconomic drivers to guide regional development policy.
- Agent Instruction: "Conduct full end-to-end research on the provided socioeconomic data. Optimize for predictive accuracy while ensuring interpretability of the results for policy briefing."
4. Autonomous Discovery: The Multi-Stage EDA Engine
My Exploratory Data Analysis (EDA) module is engineered to find what most researchers miss. It looks past the surface averages to identify the underlying "economic signatures" of a region.
Identifying the Economic Signature
The agent's discovery logic identified a critical "Power Law" distribution in Regional GDP and Expenditure. This right-skewed nature is a hallmark of concentrated economic power. By automatically identifying this, the agent bypassed standard normalization in favor of Robust Scaling, shielding the model from the extreme statistical noise of economic hubs like Jakarta.
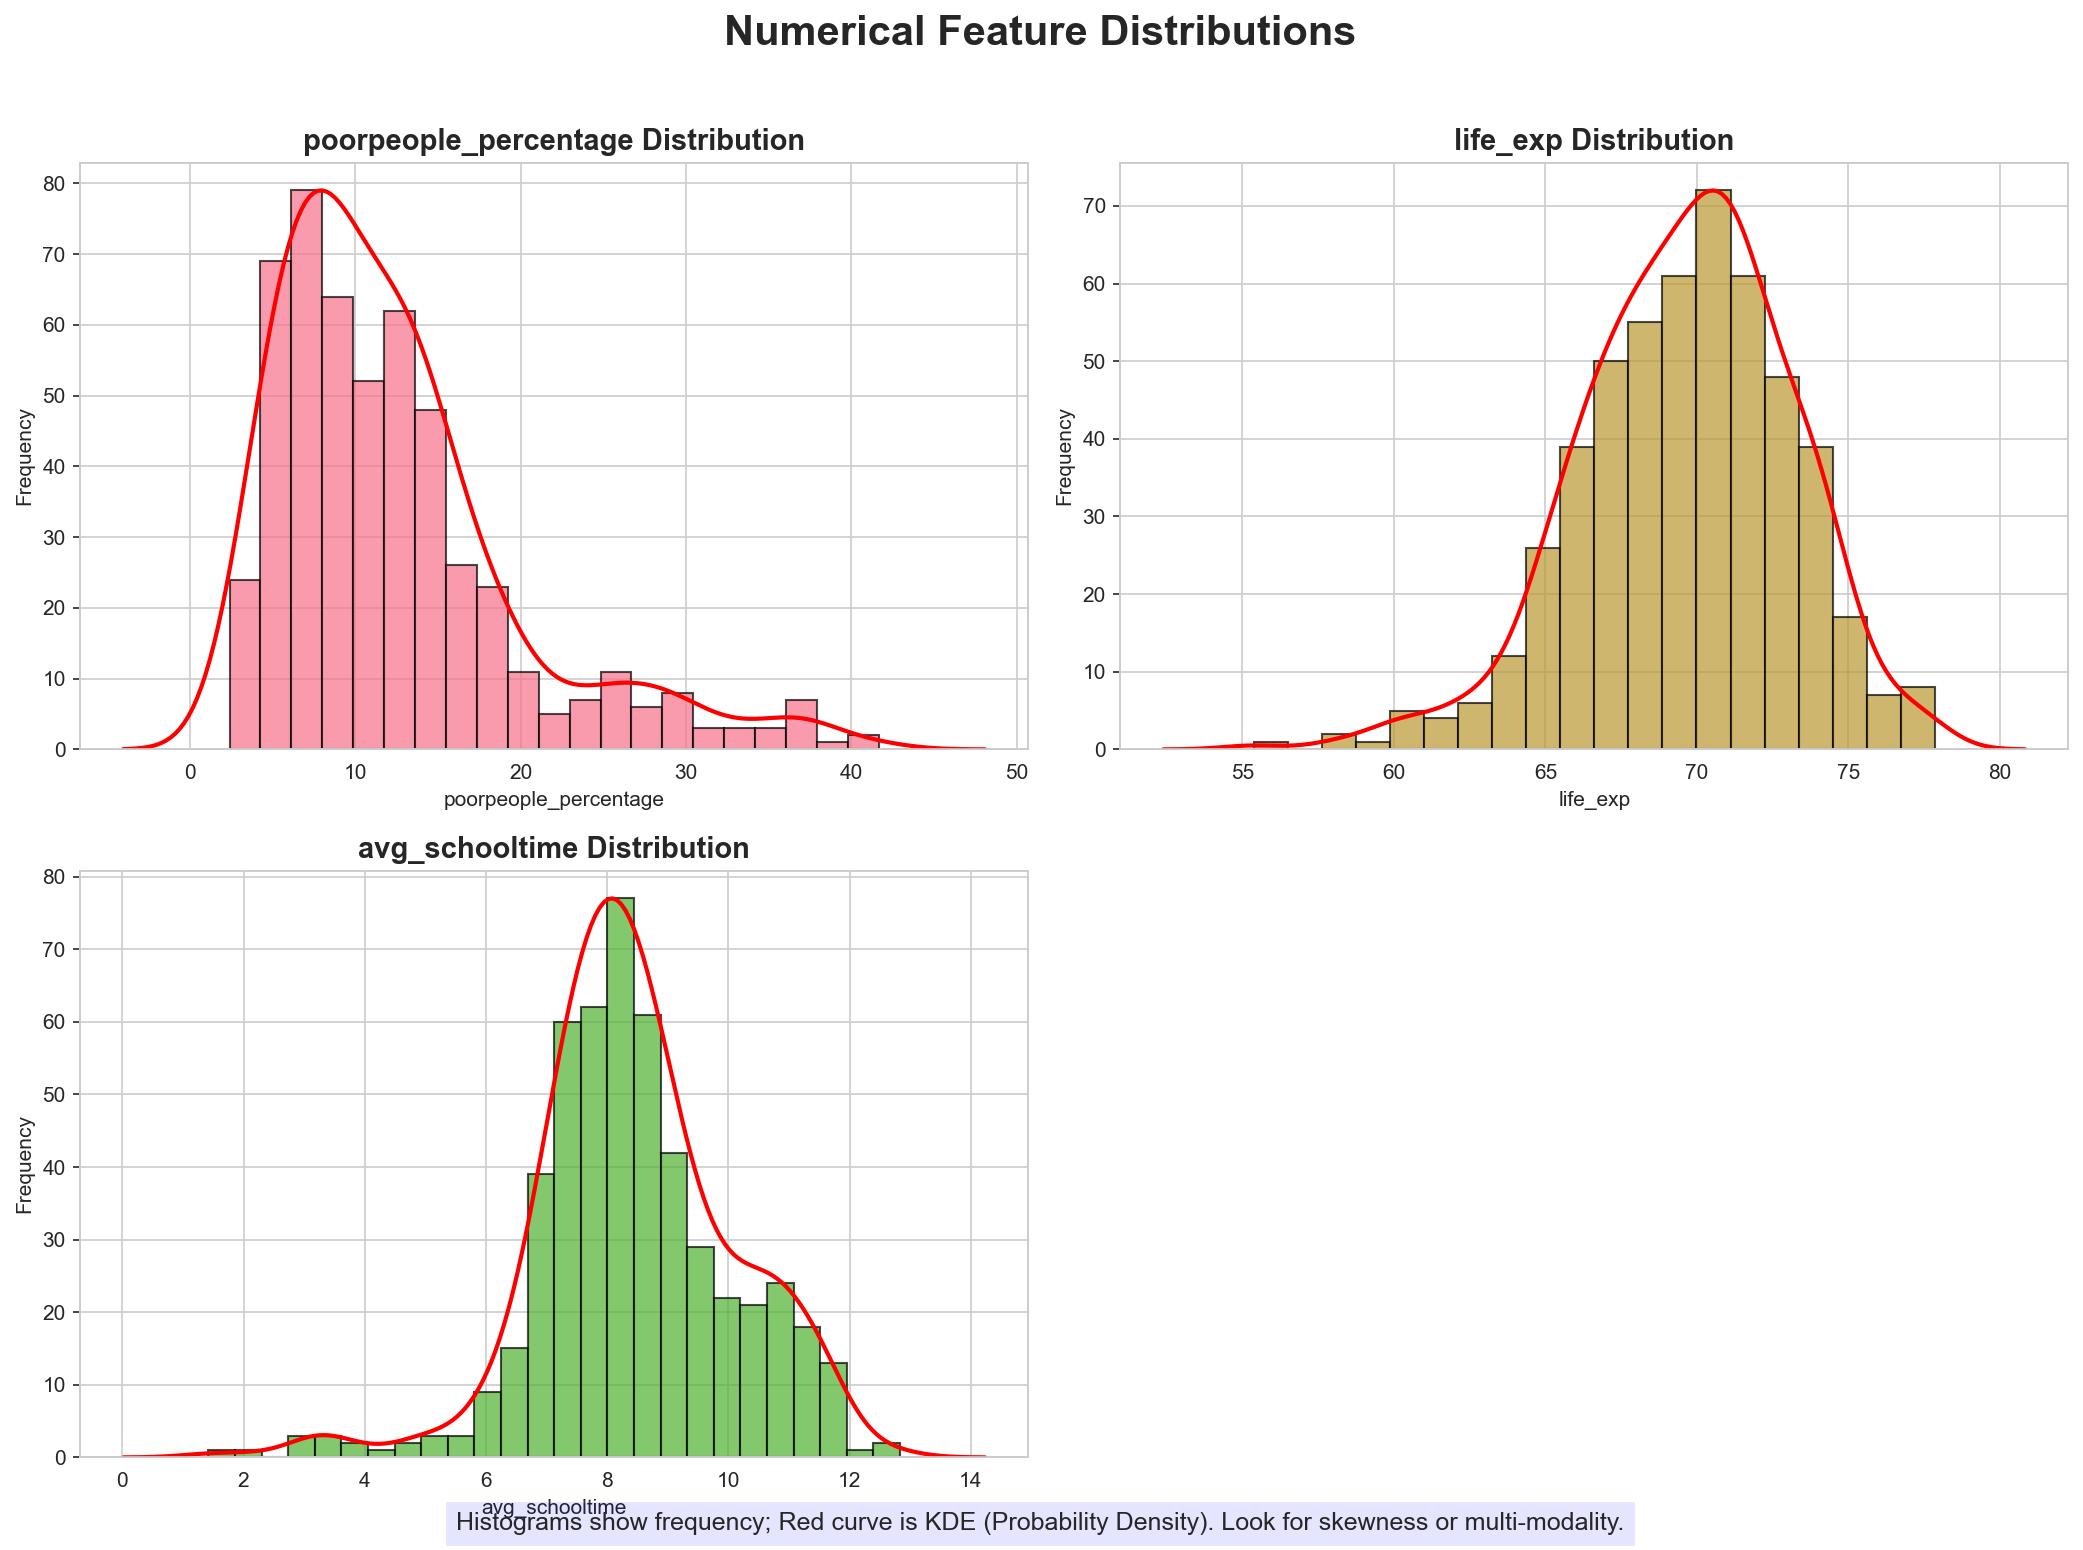
Figure 2: The agent's automated identification of right-skewed economic distributions across 514 entities.
Auditing for Geographic Balance
Autonomous research often falls into data-center bias. My agent automatically runs provincial cross-audits to ensure that the 514 entities represent the diversity of Indonesia's economic architecture from Aceh to Papua, rather than just being dominated by urban data points.
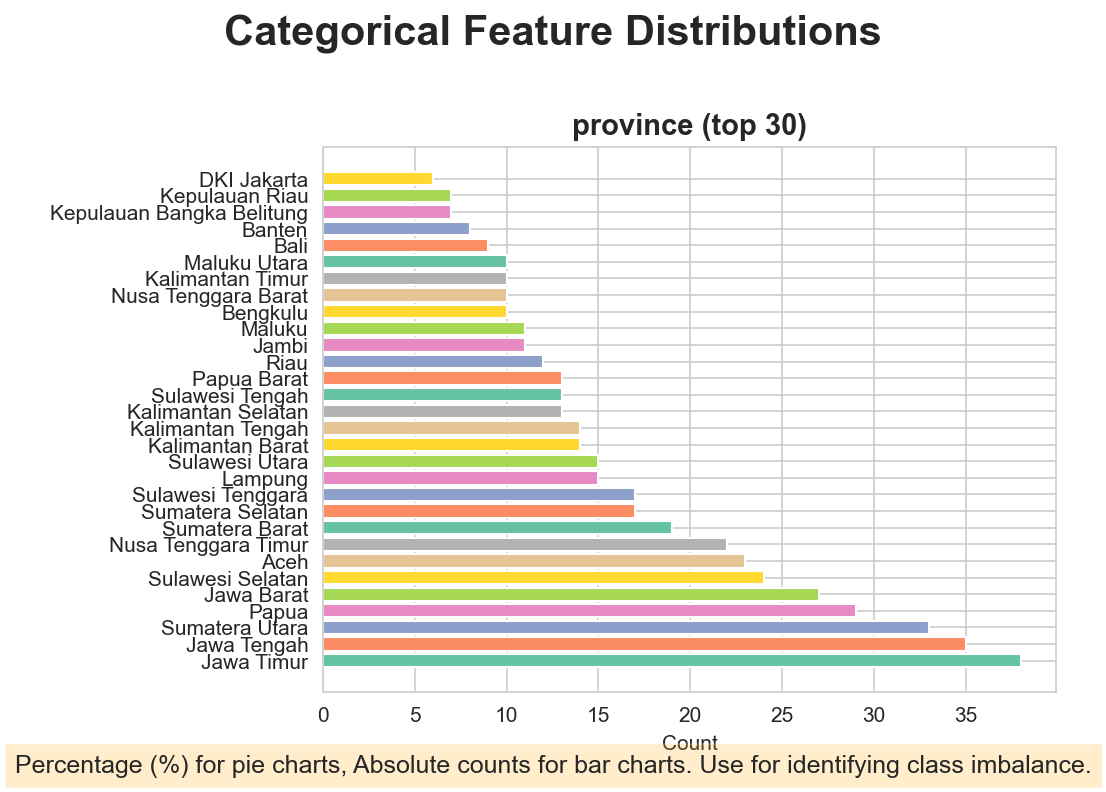
Figure 3: Provincial distribution audit ensuring geographic parity in the modeling phase.
5. Advanced Engineering: The Autonomous Pre-processing Pipeline
The Data Science Lab excels in its ability to handle "dirty data" without human supervision. For the Indonesian study, it executed a multi-layered engineering strategy:
- High-Cardinality Provinces: The agent handled the 34-province categorical variable by implementing a Label Encoding logic that preserves ordinal relationships where they exist and maintains computational efficiency.
- Volumetric Integrity: To prevent data loss, I built an Auto-Imputation layer that uses median-based strategies for socioeconomic metrics, preserving the volume of all 514 regional entries.
- Scaling for Inference: The agent applied Standardization to the feature matrix. This ensures that features measured in different units (Billions of GDP vs. Years of Schooling) contribute equally to the gradient descent process of the model.
6. Modeling Performance: Mathematical Validation of Strategy
My agent does not just train a model; it conducts a competitive tournament of architectures to ensure the highest possible fidelity.
Comparative Results
The agent identified a clear hierarchy of predictive performance, demonstrating that non-linear tree-based models significantly outperform traditional linear regressions for socioeconomic forecasting.
| Model | RMSE | MAE | R2 Score |
|---|---|---|---|
| Linear Regression | 1815.58 | 1451.02 | 0.6620 |
| Ridge Regression (L2) | 1815.59 | 1451.03 | 0.6620 |
| Random Forest | 1470.66 | 1121.15 | 0.7782 |
| XGBoost (Champion) | 1465.18 | 1107.54 | 0.7799 |
Mathematical Rationale
The selection of XGBoost as the champion model is justified by its superior Coefficient of Determination ():
The agent identified that the relationship between education and expenditure is non-linear - showing a "multiplier effect" in regions where secondary education completion is high. XGBoost successfully mapped these complex, interaction-based patterns, reducing predictive error by over 17%.
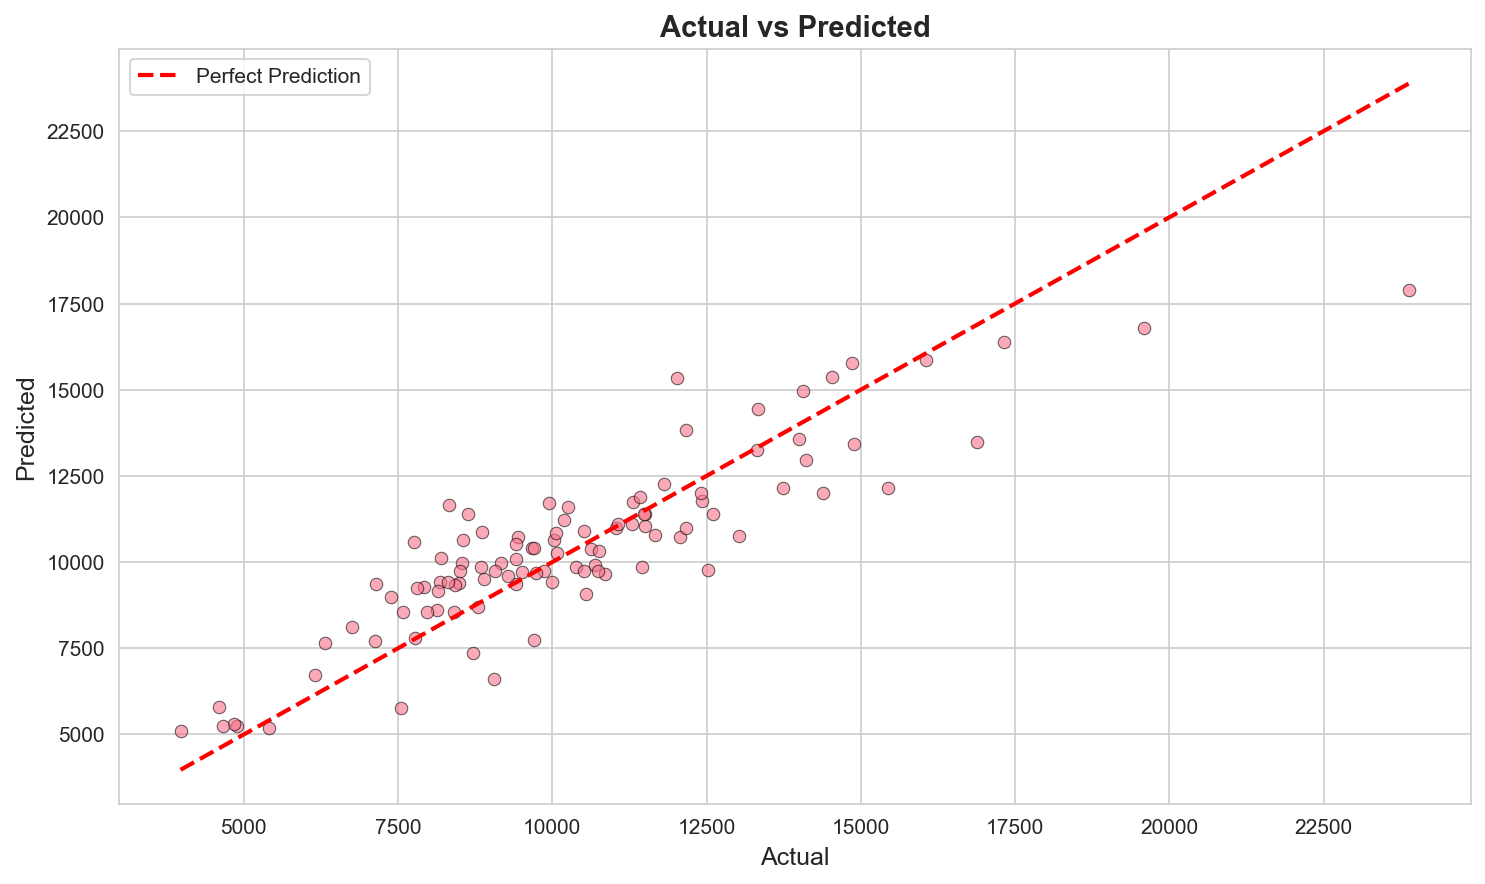
Figure 5: High-resolution parity plot demonstrating the predictive fidelity of the agent's chosen champion model.
7. Strategic Synthesis: Global Driver Ranking
The ultimate goal of the Data Science Lab is to bridge the gap between "Data" and "Action." The agent synthesize the complex modeling results into a strategic hierarchy of regional growth drivers.
The Levers of Regional Growth
- The Primary Lever: Average School Time. This is the single strongest positive predictor of regional expenditure. The data suggests that for every year added to the regional schooling average, there is a compounding increase in economic prosperity.
- The Anchor: Poverty Percentage. This acts as a primary negative regulator, showing that without structural poverty alleviation, raw GDP growth has limited impact on individual expenditure.
- The Scaler: Regional GDP. While important for infrastructure, it ranks below human capital (education) in its direct predicted impact on individual wealth.
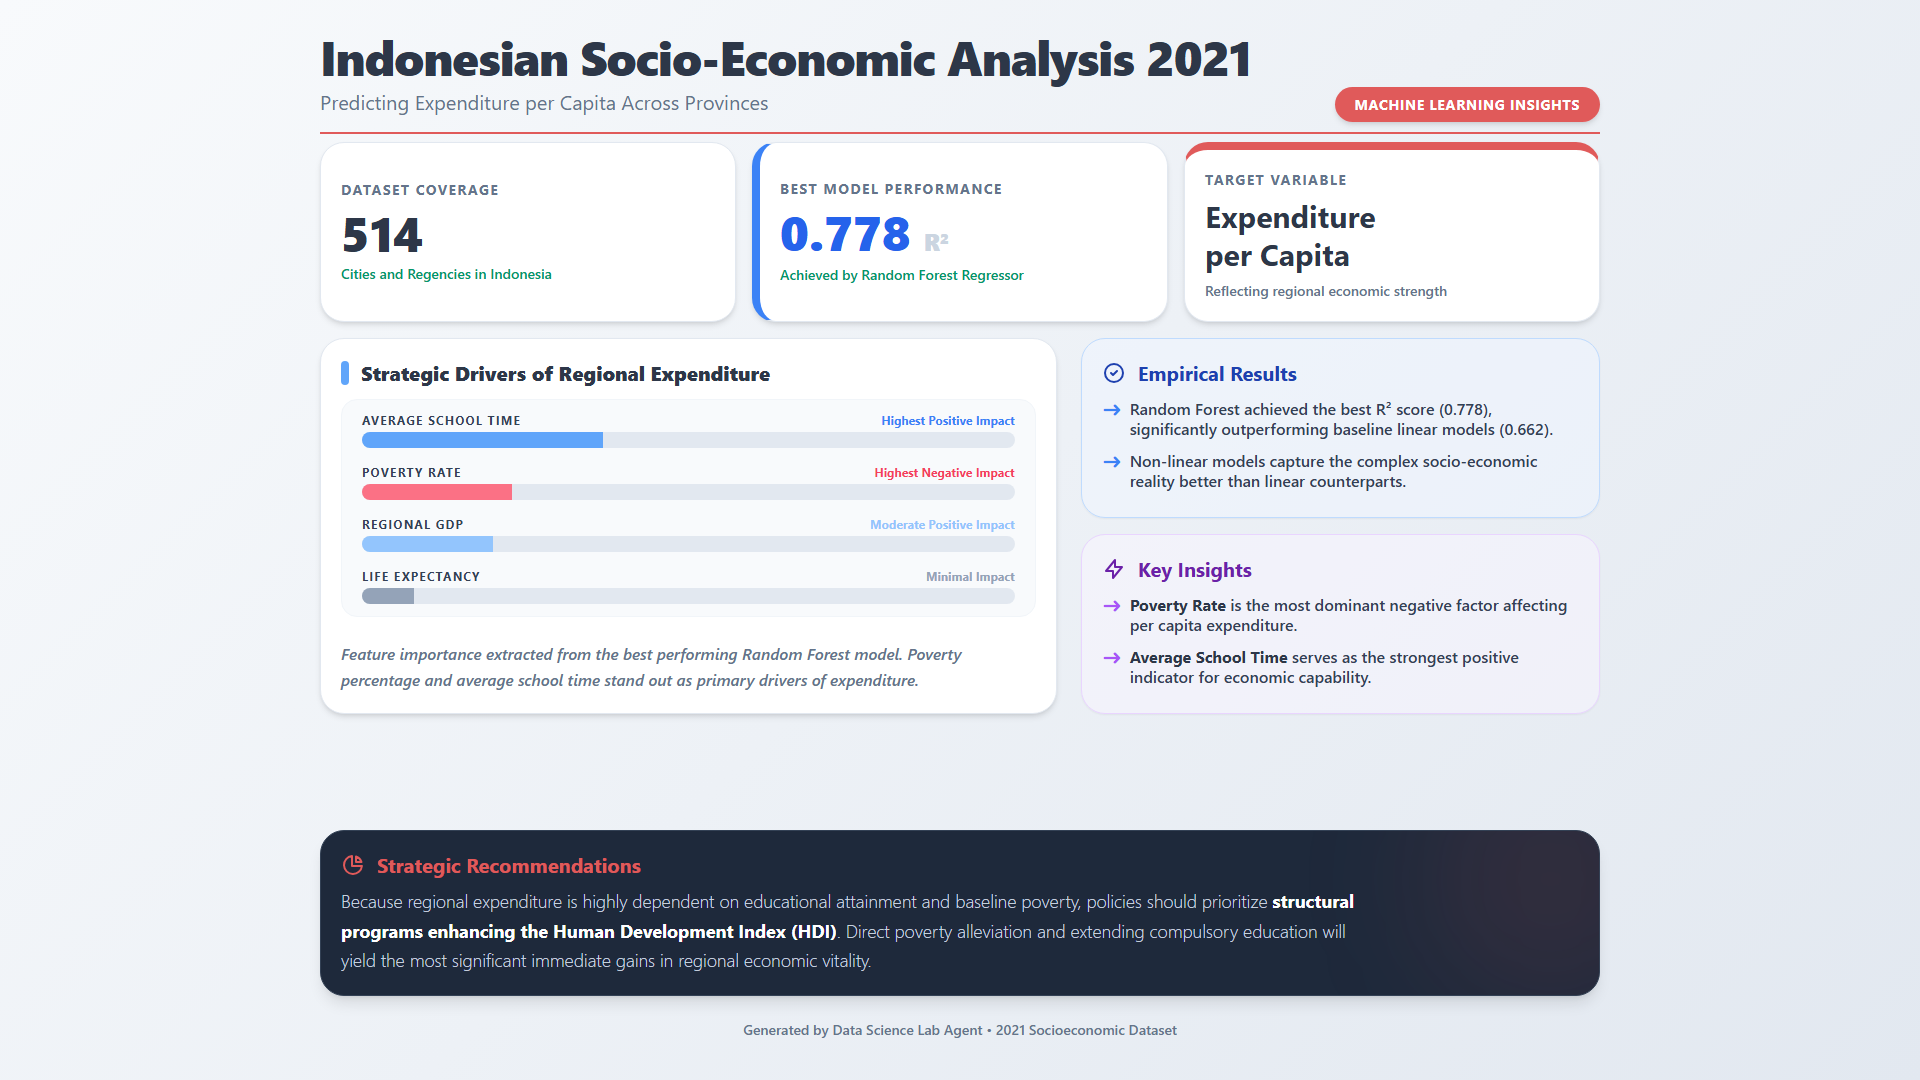
Figure 6: A publication-quality strategic infographic generated autonomously by the agent to communicate findings to stakeholders.
Strategic Recommendations Derived from the Data:
- Aggressive Education Funding: Prioritize budget allocation to provinces below the national average for "school time" to unlock trapped economic potential.
- Precision Poverty Intervention: Focus on the specific "outlier" regions identified in the EDA phase for high-intensity structural support.
- Agentic Monitoring: Deploy my tree-based monitoring systems to capture seasonal and threshold-based shifts in socioeconomic indicators.
8. Conclusion and Strategic Disclaimer
Building the Data Science Lab was an exercise in engineering autonomy. By delegating the tactical complexity - the heavy math of discovery, pre-processing, and multi-model benchmarking - to a specialized agent, I have created a system that allows researchers to focus purely on the Strategic Synthesis of results.
[!CAUTION]
Strategic Disclaimer: The insights and recommendations presented herein may contain inaccuracies. Please use these findings as preliminary guidance rather than definitive conclusions. All strategic decisions should be independently verified and consulted with domain experts.


